Informática ET241/EM241/IC241/IN241/IM204
Perfilado de sección
-
Este curso es para los alumnos de 2do. año , 1er Cuatrimestre de las Ingeniería :Civil, Electrónica, Electromecánica, Industrial y Mecatrónica de la Facultad de Ingeniería.

- Todo el mundo debería aprender a programar, por que te enseña a pensar. (Steve Jobs.).
- Solo se puede encontrar una solución si se comprende el problema (La Cátedra).
- Si no puedes, te ayudamos, si no sabes te enseñamos, si no quieres aprender.. nada podemos hacer. (La Cátedra).
- Para los recursantes: Es imposible para un hombre aprender lo que cree que ya sabe. (Epicteto).
-
-
Este documento incluye: Contenido mínimo y Programa de la Materia. Cronograma de evaluaciones y contenido de cada clase. Condiciones de como se regulariza y como es el final. Otros temas que se solicitan en la planificación por Competencias. Se recomienda al alumno leer detenidamente este documento.
604.6 KB -
Sobre la utilidad del AiTutor Info Encuesta
-

- El
que no quiere razonar es una fanático;
- el que no sabe razonar es un
necio;
- el que no se atreve a razonar es un esclavo (William Drummond)
- El
que no quiere razonar es una fanático;
-

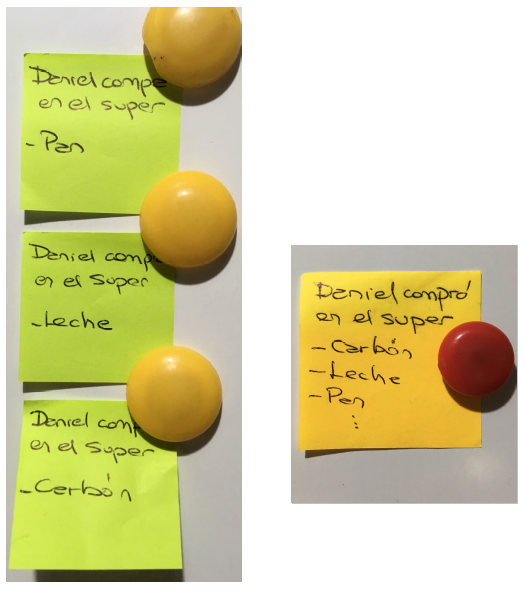
Las variables son contenedores donde almacenamos datos:
- Enteros
- Reales
- Caracteres
- Strings
- Booleanos
-

Flujo de programación condicional -

Hay distintos tipos de contenedores:
- Lista
- Diccionarios
-

-
Ejercicios Integradores propuestos para que resuelvan los alumnos.
Sr. Docente. Si Propone un ejercicio distinto a los existentes, por favor escriba en este lugar la consigna.
-
Este libro pretende poner a disposición del Alumno Ejercicios integradores resueltos. Los temas incluidos son:
- Listas
- Matrices
- Diccionarios
- Funciones
Sr. Docente. Si Propone un ejercicio y lo resuelve por favor cree un capítulo y escriba la consigna y solución propuesta.
-
A continuación se presenta un enlace a un video, con el procedimiento para subir un archivo .py y realizar la entrega de un ensayo en el Moodle.
-
Esta sección tiene ejemplos de Scripts de Python para cada especialidad de Ingeniería, de manera que el Alumno pueda ver las posibilidades de Python.
-
Estos ejercicios son para demostrar a los alumnos el uso de Python en la resolución de problemas en el ámbito de la Ingeniería Electrónica.
-
637.6 KB
-
5.4 KB
-
Estos ejercicios son para demostrar a los alumnos el uso de Python en la resolución problemas en el ámbito de la Ingeniería Civil
-
1.0 MB
-
2.8 MB
-
Estos ejercicios son para demostrar a los alumnos el uso de Python en la resolución problemas en el ámbito de la Ingeniería Industrial.
-
-
2.5 MB
-
3.4 MB
-
-
Este video explica como subir Tarea o Ensayo de Cuestionario . Recordar que los nombres NO DEBEN TENER ESPACIOS EN BLANCO, Ñ.LETRAS ACENTUADAS, ETC., solo el apellido del alumno.
Subir el arhivo .py en el que estuvo trabajando.
Este video muestra como subir dos consignas, pero en este año 2025 SOLO tendrán una consigna para el 2do Parcial!!!
-


