Lo sentimos, esta actividad está actualmente oculta
Perfilado de sección
-
Durante el primer cuatrimestre 2026, este curso es para alumnos de:* 2do. año, 1er Cuatrimestre de Ingeniería Mecatrónica,* 3er año, 1er Cuatrimestre de Electromecánica.

-
Todo el mundo debería aprender a programar, por que te enseña a pensar. (Steve Jobs.).
-
Solo se puede encontrar una solución si se comprende el problema (La Cátedra).
-
Si no puedes, te ayudamos, si no sabes te enseñamos, si no quieres aprender.. nada podemos hacer. (La Cátedra).
-
Para los recursantes: Es imposible para un hombre aprender lo que cree que ya sabe. (Epicteto).
-
-
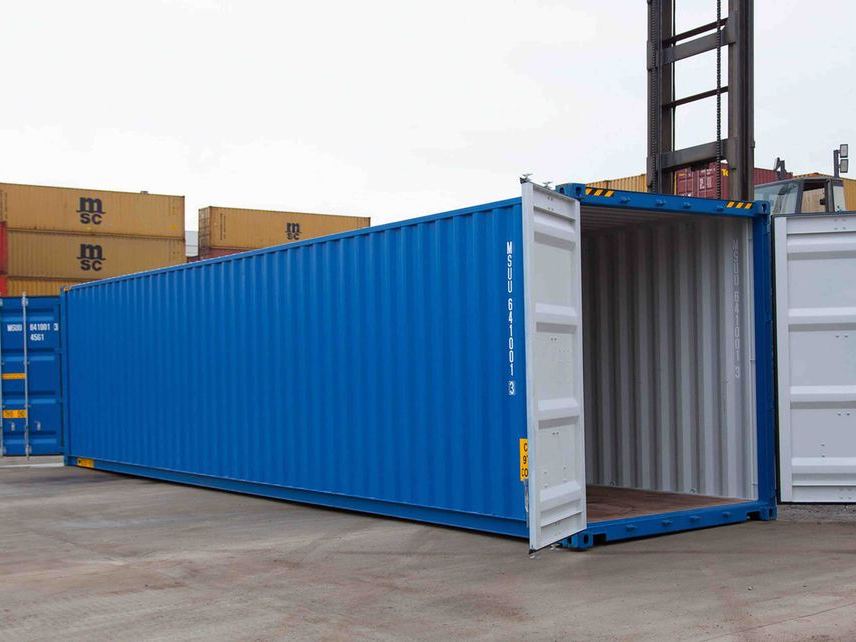
Las variables son contenedores donde almacenamos datos:
- Enteros
- Reales
- Caracteres
- Strings
- Booleanos
-
-
Actividad Integradora de Diccionarios con Lista - Comisión D3 Tarea
-
-